
While you’ve probably heard the term ‘Buyer’s Market’ or ‘Seller’s Market’, you may not be as familiar with the real estate acronym MSI. MSI stands for ‘Months Supply of Inventory’ and is a simple measure how many months it would take to completely sell out of the current inventory of available homes on the market based on the current pace of home sales.
For example, say you have a given community that has 100 homes for sale and the current pace of home sales in that area is 50 homes per month. That would give you an MSI of 2 months (100 homes available divided by 50 homes sold each month = 2 months until all of the homes are sold). By comparison, if you have the same community and the same 100 homes for sale, but the current pace of home sales is only 20 homes per month, then your MSI would be 5 months (100 homes divided by 20 per month = 5 months). If only 10 homes sold per month, the MSI increases further to 10 months. The lower the MSI, the more favorable market is for Sellers. The higher the MSI, the more favorable the market is for Buyers. A 6-month supply of homes or MSI is generally accepted as a neutral market, i.e. not favoring the buyers or sellers.
To think about it in another way, if you walk into a community that has 10 homes for sale but only 2 potential buyers, those 10 homes are going to have to compete against each other in order to earn the attention (and purchase contract) of those 2 buyers. So in order to do that, those 10 homes are going to have to lower their prices, thus creating a ‘Buyer’s Market’. With only 2 available Buyers, the Sellers know that 8 out of 10 of those homes are not going to sell, so if they want to be 1 of the 2 homes that actually does sell, they’re going to have to attract that Buyer’s attention through a good deal or low price. Alternatively, if there’s the same 10 homes for sale, but now there’s 100 buyers interested in that community, those Sellers get to raise the prices of their home and let the Buyers compete against each other. Since 90 out of those 100 Buyers won’t end up with a home, the 10 lucky ones that do will have to make very competitive offers on those 10 available homes (i.e. pay more), thus creating a ‘Seller’s Market’.
It’s the basic law of supply and demand. Low supply and high demand yields higher prices, whereas high supply and low demand yields lower prices. What is true of cars, PS5’s, that hot toy your kid wants for Christmas, etc. is also true when it comes to housing.
Here’s a snapshot of the MSI for single family homes in Tampa over the past few years:
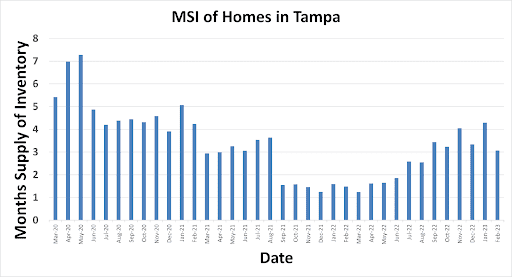
With the exception of April and May of 2020 (right after Covid started), we’ve been in a ‘Seller’s Market’ in Tampa as our MSI has been well below a 6-month supply. And from late 2021 through mid-2022, we were in an extremely low supply of inventory (below 2 months) or a very strong Seller’s Market. This triggered multiple offers, with numerous sales closing well over the list price due to bidding wars. As interest rates started to climb, late summer of 2022, buyer activity slowed and our MSI increased to around a 4-month supply.
As a professional Realtor® that monitors my local market, I’ll keep you informed of how the local market is trending and how to position yourself accurately on the market – as either a Buyer or Seller. I can even provide these stats for your local zip code and specific property type (i.e. single family home, townhome or condo) to help you with making an informed real estate decision.